Simulated continuous time series
In [1]:
%matplotlib inline
import matplotlib.pyplot as plt
import numpy as np
import pandas as pd
import fem
print 'number of threads: %i' % (fem.fortran_module.fortran_module.num_threads(),)
number of threads: 8
In [2]:
n = 10
w = fem.continuous.simulate.model_parameters(n)
In [3]:
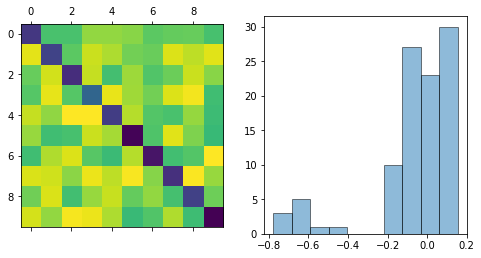
fig, ax = plt.subplots(1, 2, figsize=(8,4))
ax[0].matshow(w)
w_flat = w.flatten()
hist = ax[1].hist(w_flat, ec='k', alpha=0.5)
plt.show()

In [4]:
x = fem.continuous.simulate.time_series(w, l=1e4)
In [5]:
tab = []
for i in range(n):
    tab.append([x[i].min(), x[i].max(), x[i].mean()])
pd.DataFrame(data=tab, columns=['min', 'max', 'average'], index=1+np.arange(n))
Out[5]:
| min | max | average | |
|---|---|---|---|
| 1 | -4.134939 | 4.364350 | -0.008344 |
| 2 | -5.423651 | 5.167732 | 0.005973 |
| 3 | -3.816928 | 4.393365 | 0.011712 |
| 4 | -4.730983 | 5.091865 | 0.027664 |
| 5 | -5.311236 | 4.631144 | 0.013681 |
| 6 | -3.984726 | 4.413607 | 0.024554 |
| 7 | -4.664567 | 4.696285 | -0.037184 |
| 8 | -4.685013 | 4.697462 | 0.028402 |
| 9 | -4.074406 | 4.059182 | 0.011195 |
| 10 | -3.779413 | 4.223529 | -0.008984 |
In [6]:
fig, ax = plt.subplots(n, 1, figsize=(16,4))
for i in range(n):
    ax[i].plot(x[i, :500], 'k-')
    ax[i].axis('off')

In [7]:
x1, x2 = x[:,:-1], x[:,1:]
iters = 10
w_fit, d = fem.continuous.fit.fit(x1, x2, iters=iters)
In [8]:
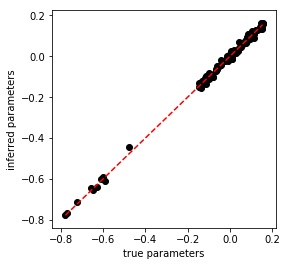
fig = plt.figure(figsize=(4,4))
ax = plt.gca()
w_fit_flat = w_fit.flatten()
ax.scatter(w_flat, w_fit_flat, c='k')
grid = np.linspace(w.min(), w.max())
ax.plot(grid, grid, 'r--')
ax.set_xlabel('true parameters')
ax.set_ylabel('inferred parameters')
plt.show()
